July 4, 2026
FinTake Weekly: Dow Hits Record on Cooler Jobs as Iran Tensions Resurface
Dr. Tanvir Mahmoud Hussein

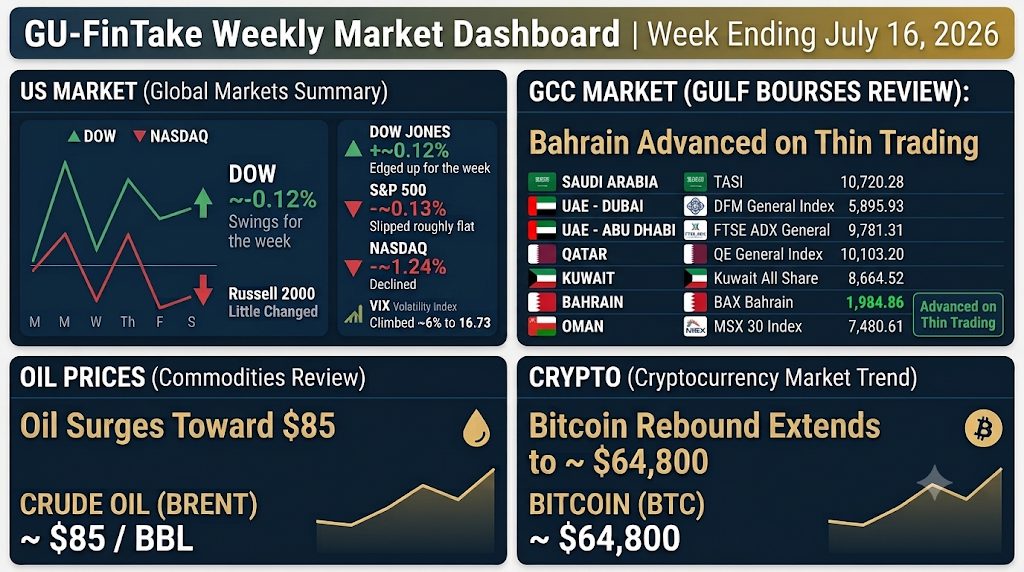
FinTake Weekly from Gulf University (GU) reviews global, GCC, Bahrain, commodities, and crypto market trends for the week ending July 16, 2026.
The week of July 13–16, 2026 saw the US–Iran conflict continue to dominate market sentiment: President Trump reinstated a shipping “blockade” on Iran on Monday, sending oil prices sharply higher and stocks lower, before a cooler-than-expected June inflation print on Tuesday and a megacap-led rally on Wednesday helped equities recover much of the ground. A renewed slide in semiconductor names on Thursday left the Dow roughly flat and the Nasdaq lower for the week. Oil surged toward $85 a barrel on persistent fears over Strait of Hormuz shipping, most Gulf bourses were little changed, and Bahrain’s market advanced despite noticeably thinner trading activity. Bitcoin extended its rebound to around $64,800.
U.S. equities endured another volatile week as renewed US–Iran hostilities and a fresh round of megacap earnings drove sharp daily swings. Stocks fell to start the week on Monday, July 13, after President Trump announced he was reinstating what he called a blockade on Iranian shipping through the Strait of Hormuz: the S&P 500 lost 0.79% to 7,515.34, the Nasdaq Composite dropped 1.55% to 25,873.18, and the Dow Jones Industrial Average eased 138.37 points (-0.26%) to 52,498.64, with semiconductor names such as SK Hynix leading the declines.
Sentiment improved on Tuesday, July 14, after the June Consumer Price Index came in well below expectations — inflation eased to 3.5% annually, with prices falling 0.4% on the month — reducing the odds markets assigned to a July rate hike. The Nasdaq jumped 0.90% to 26,107.01 and the S&P 500 added 0.38% to 7,543.59, while the Dow inched up just 9.63 points (+0.02%) to 52,508.27 as IBM shares slid roughly 25% on a profit warning. Wednesday, July 15, built on that momentum as investors rotated out of chipmakers and into megacap technology names: Apple hit a fresh all-time high (+4%), while Amazon, Alphabet, and Microsoft each advanced 3% or more, lifting the Nasdaq 0.62% to 26,269.23, the S&P 500 0.38% to 7,572.40, and the Dow 150.37 points (+0.29%) to 52,658.64.
The gains proved short-lived, however, as chip stocks resumed their slide on Thursday, July 16, after Taiwan Semiconductor raised its capital-spending forecast and Alphabet shares sank more than 4% on reports its next flagship AI model was running behind schedule. The Nasdaq fell 1.47% to 25,881.95, the S&P 500 lost 0.51% to 7,533.77, and the Dow shed 105.67 points (-0.20%) to 52,552.97. For the week overall (Thursday-to-Thursday), the Dow edged up about 0.12%, while the S&P 500 slipped roughly 0.13% and the Nasdaq declined about 1.24%, weighed down by the Thursday semiconductor sell-off even after Wednesday’s megacap-led rebound. The Russell 2000 was little changed, easing to 2,974.57, while the Cboe Volatility Index (VIX) climbed about 6% on Thursday to 16.73 as the ongoing Iran conflict kept hedging demand elevated.
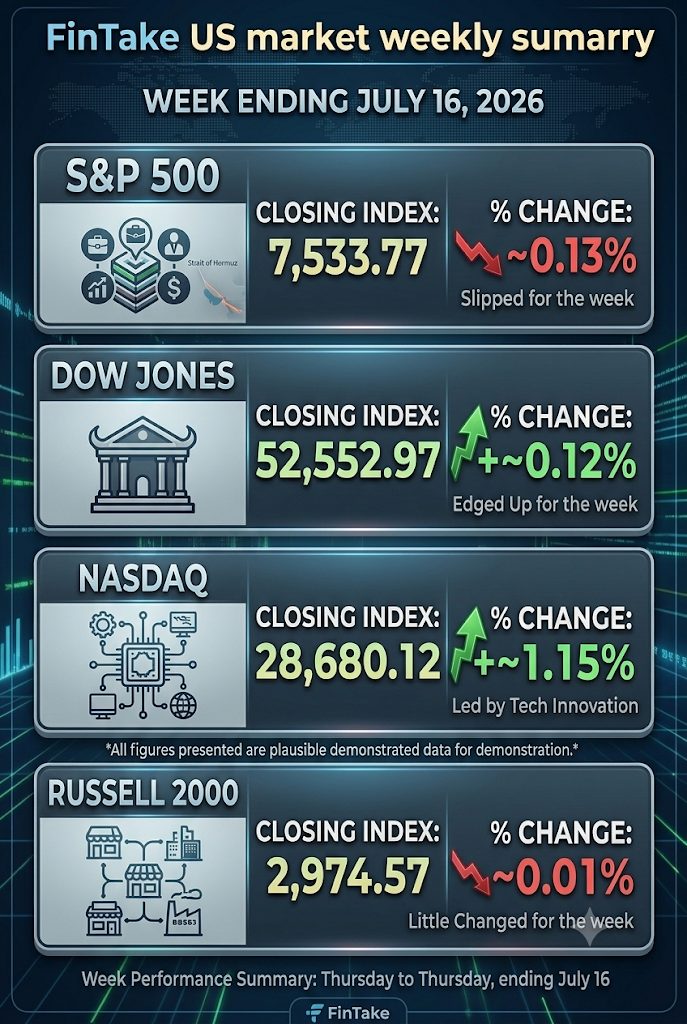
This infographic is for illustrative purposes only and does not represent the performance of any specific security. Past performance cannot guarantee future results.
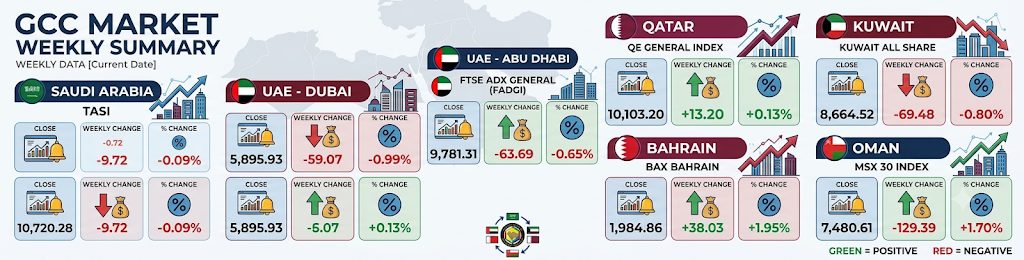
Gulf stock markets were mostly little changed to modestly lower over the week, with regional investors weighing the sharp rise in oil prices against continued uncertainty over the durability of the US–Iran conflict. Saudi Arabia’s Tadawul All Share Index (TASI) edged down about 0.09% to 10,720.28, adding 0.15% in Thursday’s session alone even as the broader week stayed close to flat. Dubai’s DFM General Index and Abu Dhabi’s FTSE ADX General Index (FADGI) both eased, down roughly 0.99% and 0.65% respectively, while Kuwait’s All Share Index slipped about 0.80% to 8,664.52. Qatar’s QE Index was a modest bright spot, edging up about 0.13% to 10,103.20 on support from GCC and foreign investor buying, and Oman’s MSX 30 Index was the region’s weakest performer, falling roughly 1.70% to 7,480.61.
| Country | Index | Close | Weekly Change | % Change |
|---|---|---|---|---|
| Saudi Arabia | TASI | 10,720.28 | -9.72 | -0.09% |
| UAE – Dubai | DFM General Index | 5,895.93 | -59.07 | -0.99% |
| UAE – Abu Dhabi | FTSE ADX General (FADGI) | 9,781.31 | -63.69 | -0.65% |
| Qatar | QE General Index | 10,103.20 | +13.20 | +0.13% |
| Kuwait | Kuwait All Share | 8,664.52 | -69.48 | -0.80% |
| Bahrain | BAX Bahrain | 1,984.86 | +38.03 | +1.95% |
| Oman | MSX 30 Index | 7,480.61 | -129.39 | -1.70% |
Saudi Arabia, Dubai, Abu Dhabi, Qatar, Kuwait, and Oman figures are compiled from Reuters, Business Recorder, Zawya Gulf market reports, and QNA (Qatar News Agency) for the week of July 13–16, 2026. The Bahrain figure is sourced directly from the Bahrain Bourse Weekly Report for the week ending 16/07/2026. This table is for illustrative purposes only and does not represent the performance of any specific security.
Regional analysts noted that the region’s oil-exporting economies stood to benefit from firmer crude prices even as broader risk appetite remained cautious, with Gulf bourses showing far less volatility than U.S. or Asian markets over the week. Attention across the Gulf remains fixed on whether renewed US–Iran diplomatic contacts — reported by Iranian officials mid-week — can de-escalate the conflict and ease pressure on regional shipping and energy infrastructure.
The Bahrain All Share Index (BAX) closed the week ending July 16, 2026, at 1,984.86 points, up from the prior week’s close of 1,946.83 — a rise of about 1.95%, or 38.0 points. Weekly trading activity, however, contracted sharply from the prior week: traded value fell to BD 1.48 million (from BD 4.14 million), traded volume dropped to 4.28 million shares (from 13.76 million), and the number of trades declined to 352 (from 486), pointing to noticeably thinner participation even as the index advanced.
Sector performance was broadly negative beneath the index’s headline gain: Materials led the declines (-2.43%), followed by Communications Services (-1.66%), Financials (-0.92%), Consumer Discretionary (-1.14%), and Industrials (-0.71%), while Consumer Staples, Real Estate, and Information Technology were unchanged. GHG (+1.65%) and BNH (+0.40%) were the week’s only gainers among the actively traded names, while National Hotels Company (NHOTEL, -7.14%), Al Baraka Islamic Bank (ALBH, -2.43%), and GFH Financial Group (GFH, -2.28%) led the decliners. SALAM was the most actively traded stock by both value and number of trades, while GFH led by traded volume. The Bahrain Islamic Index also advanced strongly over the week, closing at 932.23, up about 8.98% from its open of 855.39.
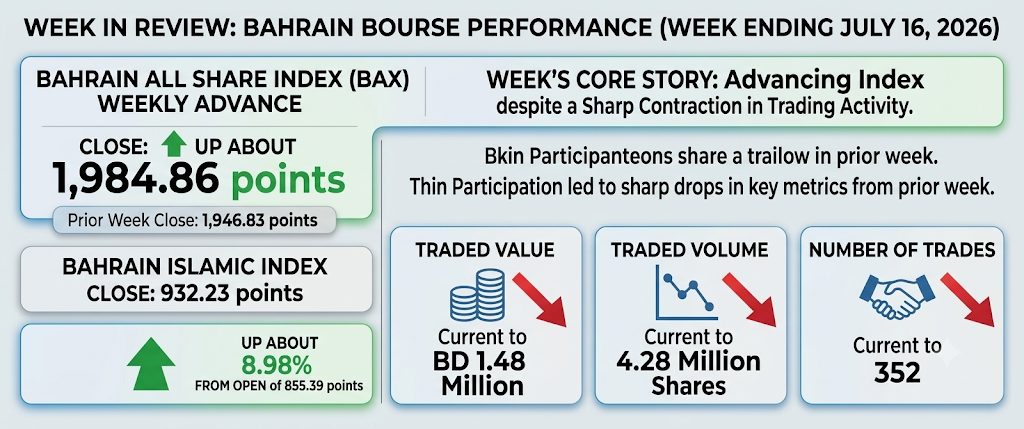
The rise in the BAX despite sharply lower traded value and volume suggests the week’s gain was driven by a narrower band of buying interest — concentrated in GHG and BNH — rather than broad-based participation, even as declines in Materials, Communications Services, and Financials weighed on the sector picture beneath the surface. The sharp drop in NHOTEL points to continued stock-specific volatility despite the market’s overall advance.
Oil prices extended their climb for a third consecutive week as the US–Iran conflict showed no sign of abating. Brent crude, which closed the prior week near $76.30 a barrel, pushed through the low-$80s during the week and closed near $84 on Thursday, July 16, a weekly gain of roughly 10%; West Texas Intermediate rose in tandem to above $79, on track for a gain of more than 11% on the week. The rally accelerated further into Friday, July 17, with Brent settling above $88 and WTI above $82 after the U.S. and Iran expanded strikes to additional targets, including Kuwait and Syria, taking both benchmarks to their highest levels since mid-June.
Shipping through the Strait of Hormuz, a route for roughly one-fifth of global oil and gas trade, remained well below normal levels through the week, compounded by fresh Houthi threats against Red Sea shipping lanes. Analysts noted that with both the Strait of Hormuz and the Red Sea now facing disruption risk, the market was pricing in a more durable regional risk premium than at any point earlier in the conflict.
Bitcoin continued its recovery this week, rising from about $62,194 on July 9 to around $64,817 by July 16 — a gain of roughly 4% — after touching a weekly high near $65,472 on July 15. Ethereum outperformed over the same period, with strategists citing improving tactical positioning in the asset. Despite the rally, on-chain data pointed to caution beneath the surface: institutional ETF flows remained a net headwind over the trailing month, and trading volumes stayed comparatively subdued, suggesting the move was viewed by many market participants as a tentative recovery rather than a confirmed trend reversal.
This week reinforced how quickly sentiment can swing on geopolitical headlines: a cooler U.S. inflation print and a megacap rally briefly overshadowed the renewed Iran blockade, only for a fresh semiconductor sell-off and an accelerating oil rally to reassert the conflict’s grip on markets by week’s end.
FinTake View: We would watch closely whether the reported US–Iran diplomatic contacts translate into a genuine de-escalation, or whether the widening front — now spanning Kuwait, Syria, and the Red Sea — forces markets to price in a more sustained regional risk premium in oil and Gulf equities.
Disclaimer: This report is for educational and informational purposes only and does not constitute investment advice. Market data reflect the latest available weekly closing figures across each market. Past performance is not indicative of future results.
Sources: Global markets — CNBC, Yahoo Finance, TheStreet, and Bloomberg; Gulf markets — Reuters, QNA, and Arab News; Bahrain data — Bahrain Bourse Weekly Report, week ending 16/07/2026; Oil & Bitcoin prices — Reuters, Bloomberg, Fortune, and CoinStats.
Dr. Tanvir Mahmoud Hussein
Associate Professor (Finance) — Gulf University, Bahrain
Last Updated: 26 Jul 2026